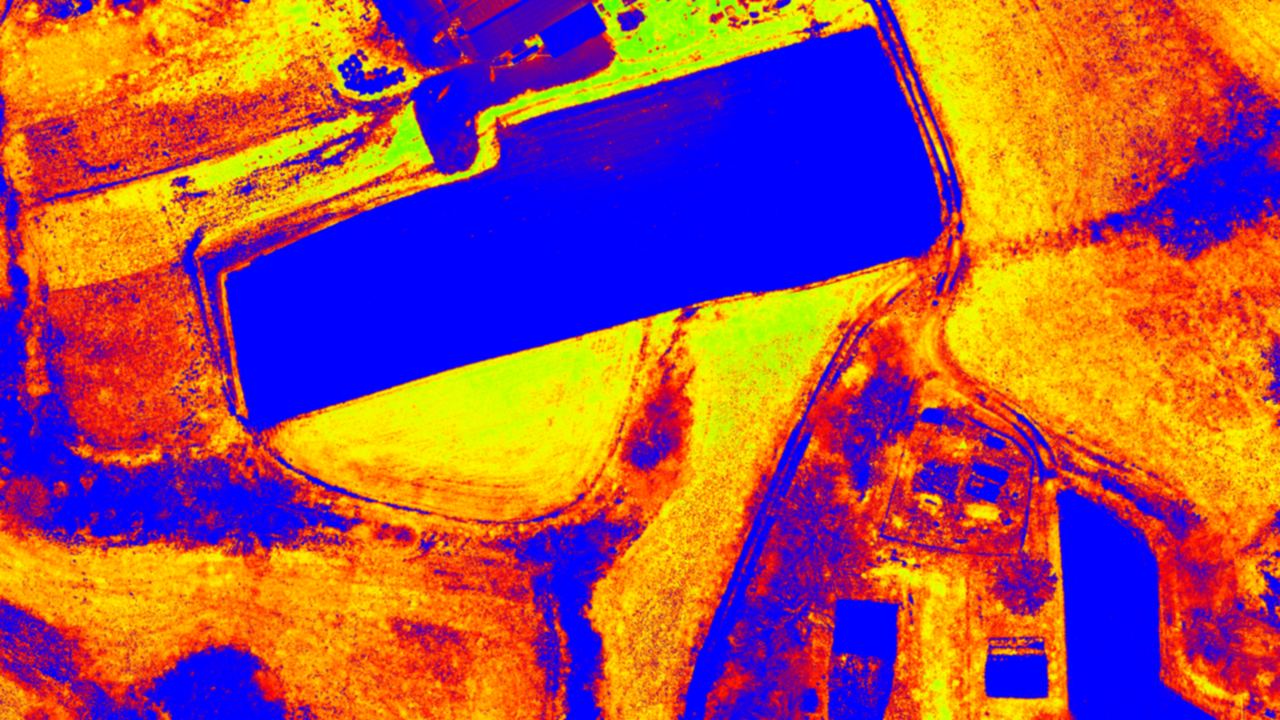
Multispectral and thermal imagery shows what the eye cannot see
Special cameras capture light in the near infrared and the heat radiated by surfaces. This results in maps of vegetation vitality and of temperature, covering the whole area and georeferenced.
Key facts
What you use multispectral and thermal data for
Calibrated spectral and thermal data provide objective measurements for forestry analyses, building physics inspections and municipal climate strategies.
Vegetation and forest condition
Narrowband near infrared detects differences in vitality, drought stress and pest infestation in stands at an early stage. Calculated vegetation indices such as the NDVI serve as a basis for forestry reports.
A good fit for Environment & NatureEnvironmental monitoring over time
Repeat flights make slow changes in vegetation and moisture precisely quantifiable. Ideal for verifying results in nature reserves and renaturation areas.
A good fit for Environment & NatureEnergy inspection of building envelopes
Thermograms identify thermal bridges, poor insulation and air leaks on roofs and facades. They provide a sound data basis for energy refurbishment concepts.
A good fit for Government & AuthoritiesQuality assurance for photovoltaics
Thermal flights quickly reveal hotspots, defective diodes and cell damage on rooftop and ground-mounted plants. That protects the yield and reduces the risk of overheating.
A good fit for Construction & InfrastructureUrban climate and heat islands
Temperature maps covering whole areas reveal where densely built-up districts overheat. They support municipalities in climate-adapted planning and in projects to unseal surfaces.
A good fit for Government & AuthoritiesMonitoring of pipelines and district heating
Thermal sensors detect thermal anomalies along buried pipelines. This makes it possible to pinpoint damaged insulation and leaks without excavation.
A good fit for Construction & InfrastructureImpressions from our projects

What you receive from us
We process multispectral and thermal data into geometrically rectified, radiometrically calibrated orthomosaics in the Swiss national network, ready for direct use in GIS.
- Vegetation indices (NDVI, NDRE and others): delivered as a quantitative 32-bit float raster with exact values and as a classified colour map for quick interpretation
- Radiometric thermal orthomosaic: georeferenced thermal image with absolute temperature values per pixel (in degrees Celsius or kelvin) for precise building physics and technical analyses
- Colour infrared orthophoto (CIR): high-resolution composite for visually assessing canopy closure, vegetation structures and the limits of vitality
- Standardised data formats: georeferenced GeoTIFF and Cloud Optimized GeoTIFF (COG) files, matched exactly to your GIS and CAD system

Technical details
We define the values together with you for each project.
| Spectral ranges | Visible spectrum (RGB), red edge (about 705 to 740 nm), near infrared (NIR, about 840 nm) and long-wave thermal infrared (LWIR, 8 to 14 µm) |
|---|---|
| Vegetation indices | NDVI, NDRE, GNDVI, LCI, OSAVI, MCARI and customer-specific band combinations by arrangement |
| Data structure and colour space | Quantitative 32-bit float rasters with the original reflectance values and classified 8-bit colour palettes for visualisation |
| Coordinate system | Swiss national coordinates (LV95 with LN02 or LHN95), railway reference systems (LV95 SBB) and international systems such as WGS84 and UTM |
| Delivery format | Radiometrically calibrated GeoTIFF, Cloud Optimized GeoTIFF (COG), ASCII grid and analysis reports as PDF |
| Analysis | Delivery of fully rectified, georeferenced geodata for specialist processing by environmental and engineering offices, forestry enterprises or agronomists |
How a project works
From the first exchange to the finished geodata in your system.
-
Advice and quote
Draw your project area directly in the quote form or describe your requirements. Together we define the optimal resolution and the scope of services for your project.
-
Planning and flight
We match flight pattern, overlap and ground sampling distance precisely to the required target accuracy. Data is captured efficiently with our professional flight and sensor technology.
-
In-house processing
Aerial triangulation, classification and 3D modelling run entirely on our own high-performance computers. Even large perimeters with tens of thousands of images are processed with complete consistency and reproducibility.
-
Delivery and proof
You receive ready-to-use geodata, tailored exactly to your coordinate system, your software and your tiling requirements, including transparent proof of accuracy.
When your own imagery pays off
Freely available satellite data provide regular vegetation indices, but with grid spacings of 10 metres and more they remain purely macroscopic. The official flights by swisstopo do cover high-resolution near infrared with SWISSIMAGE, but they follow a cycle of several years and contain no narrowband or thermal bands. Your own flights are needed when the date of capture must be current, when individual objects require centimetre resolution or when radiometric surface temperatures are needed.
Well suited
- You need to distinguish individual plants, tree crowns or solar modules, with a ground sampling distance below a decimetre.
- Flights at phenologically critical moments, for example the start of the growing season or dry spells, or thermographic flights before sunrise.
- Quantitative temperature measurement to detect thermal bridges, leaks or defective photovoltaic cells.
- Repeatable comparison flights with identical sensors, correction for the position of the sun and a consistent method for long-term monitoring.
Less suited
- Regional forestry or agricultural overview mapping, for which satellite data such as Sentinel are sufficient.
- Multi-year baseline surveys that need neither data for a specific date nor thermal imagery.
- You are looking for an expert agronomic or forestry assessment without a precise data capture beforehand.
Frequently asked questions
What does an NDVI show?
The normalised difference vegetation index relates the absorption of chlorophyll in the red part of the spectrum to the reflectance of the cell structure in the near infrared. The resulting values between -1 and +1 quantify biomass, vitality and drought stress precisely for each stage of growth. Healthy vegetation stands out clearly from bare soil or water.
Do you also interpret the data professionally?
We deliver radiometrically calibrated, geometrically rectified primary and raster data together with technical documentation. The agronomic, forestry or building physics interpretation remains with your specialists, engineers or appointed experts.
When is thermal imagery useful?
The best moment depends on the object and on the temperature differences required. We fly building envelopes and buried district heating lines in cold night hours or early in the morning, without disturbing sunlight. Photovoltaic plants, on the other hand, require cloudless conditions under a high electrical load so that hotspots can be detected reliably.
What is the difference between CIR and NDVI?
A colour infrared image (CIR) is a classic false-colour composite that puts the near infrared on the red channel and mainly serves a qualitative, visual assessment. The NDVI is a normalised, dimensionless value calculated per pixel. Unlike an image product, it allows mathematical comparisons, threshold classifications and statistical GIS analyses.
Which data does your project need?
We advise you without obligation and show which services and which platform suit your project.