Quantitative geodata analyses from point clouds and aerial images
We turn raw data from survey flights into sound decision-making documents for planning, construction and maintenance. Whether volume balances, automated clearance gauge checks or deformation analyses, you receive dimensionally accurate results, matched exactly to your question.
Key facts
Which analyses we offer
Our specialist analyses are based on calibrated primary data from our own flights and provide measurable decision-making documents.
Volumes and mass balance
From difference models or directly from classified point clouds we calculate exact excavation, extraction and fill volumes. Comparisons between dates keep the billing transparent and auditable.
Comparisons over time
The automated comparison of two epochs quantifies topographic and structural changes to the centimetre and below. Typical applications are deformation monitoring, rockfall volumes and monitoring of construction progress.
Profiles and cross-sections
From elevation models and point clouds we derive longitudinal and cross profiles along any route axis, to the applicable standards. The profile data are ready for direct processing in CAD and alignment software.
Gradient and surface runoff
Terrain models prepared for hydrology define flow paths, depressions and watersheds in the catchment. The results form the basis for hydrodynamic 2D runoff simulations and drainage concepts.
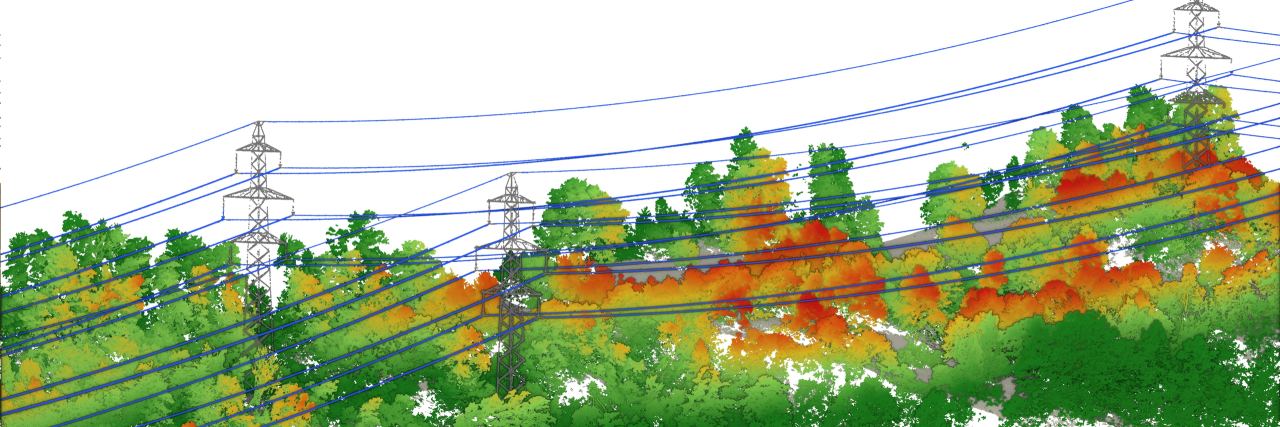
Vegetation management along corridors
From classified LiDAR point clouds we detect exactly where trees grow into a defined clearance profile. Trees at the edge that are at risk of falling onto rails and roads are identified automatically.
Clearance and sag analyses
We determine the spatial position of overhead conductors and their minimum static distances to the ground, buildings and transport routes. The survey provides sound values for load cases, conductor sag and potential hazards.
Tree mapping and green spaces
Using the normalised surface model (nDSM) and classification algorithms, we record individual trees with trunk position, tree height and crown diameter. The data feed directly into municipal tree registers and analyses of sealed surfaces.
Vegetation vitality (NDVI)
Multispectral narrowband indices show chlorophyll activity and drought stress in agricultural and forest areas. They provide objective values for the early detection of pests and for assessing stands.
Solar potential and shading
On the basis of digital surface models we simulate solar radiation, taking roof pitch and shading into account. The results quantify the real energy potential for photovoltaic systems over the course of a year.
Field of view and visibility analyses
On the basis of digital envelopes we calculate sight lines and fields of view for planned structures, towers or wind turbines. The analyses show the real exposure in the landscape, taking topography and vegetation into account.
Thermography and heat mapping
Radiometric thermal data map the microclimate and heat islands across whole settlements. On infrastructure they locate leaks in buried pipes and heat losses in buildings.
Surface and crack mapping
High-resolution orthophotos and close-ups record cracks, pavement damage and break-outs on traffic areas or roofs. Repeat captures allow complete monitoring of how damage progresses.
What you receive from us
We process the raw data from our flights into dimensionally accurate results that can be used directly in your planning and management systems. Depending on the size of the project we use flexible drone systems or combine LiDAR and image sensors on a helicopter, capturing everything at once.
- Numerical analyses and balances: structured tables and values for volume calculations, area distributions, distances to vegetation and clearance infringements.
- Thematic plans and maps: difference plans to scale (DoD), profiles, fluctuation analyses as well as vitality and heat maps.
- Seamless GIS and CAD integration: geodata in standardised formats (DWG, DXF, SHP, GeoPackage, GeoTIFF), transformed correctly into your reference frame such as LV95.
- Report on methods and accuracy: detailed documentation of the calculation basis, the algorithms, the checks at ground control points and the statistical accuracy.
- Georeferenced primary data: the underlying classified point clouds, DTM and DSM rasters and orthomosaics for further processing.

Technical details
We define the basis, results and formats together with you for each question.
| Source data | Classified point clouds (LiDAR and photogrammetry), digital terrain and surface models (DTM, DSM), true orthophotos and calibrated multispectral and thermal data |
|---|---|
| Methods of analysis | Difference models (DoD), extraction of profiles and break lines, analyses of spatial and vegetation conflicts as well as simulations of solar radiation and flow paths |
| Comparative analyses | Comparisons between epochs based on identical capture parameters or on historical reference datasets |
| Accuracy | Accurate to the centimetre in the Swiss national network, statistically verified at independent check points and documented in the test report |
| Coordinate system | Swiss national coordinates (LV95 with LN02 or LHN95), railway reference systems (LV95 SBB) and international systems such as WGS84 and UTM |
| Delivery formats | GeoTIFF, ASCII grid, LAS, LAZ, DWG, DXF, SHP, GeoPackage, map sets as PDF and structured tables as CSV and Excel |
| Interface and expert judgement | Delivery of dimensionally accurate, validated geodata and calculation models for the structural, agronomic or ecological assessment by your specialists |
How a project works
From the first exchange to the finished geodata in your system.
-
Defining the question
In the quote form you describe what you want to know. Together we clarify which analysis fits and what basis it needs.
-
Survey flight
We fly the area using the appropriate method, always in the same way for comparisons over time.
-
Analysis
We analyse the data in a traceable and repeatable way, so that later comparisons rest on the same basis.
-
Results and report
You receive figures, maps and geodata in your formats, together with a report on the basis and accuracy.
When your own analysis pays off
Federal data is sufficient for many overviews. The swissALTI3D terrain model has a grid spacing of 0.5 m and is updated every six years, the SWISSIMAGE aerial images every three years, now as a true orthophoto and, from the 2026 data onwards, with a near infrared band. swisstopo does not announce thermal images or further spectral bands. This data can therefore show a state that is several years old rather than the point in time your question requires.
Well suited
- You need the state at a specific point in time, for example before and after an intervention.
- Quantities, heights or clearances have to be documented in a traceable way.
- The same analysis should be repeatable and comparable over the years.
Less suited
- A rough overview of a large area is enough, and swisstopo data often covers that.
- The question concerns processes below the surface that cannot be captured from the air.
Frequently asked questions
Does every analysis need a new flight?
No. Point clouds and image blocks that have already been captured can be reprocessed for new questions at any time. A new flight is only needed when the current state of construction has to be captured or when differences between specific dates are to be calculated.
How accurate are volume calculations?
The accuracy of a volume calculation depends mainly on the vertical quality of the model and on the point density. Through geodetic adjustment at GNSS check points our terrain models reach height accuracies in the centimetre range. We state the derived volumes and their statistical uncertainties transparently in the calculation report.
How often should an area be flown?
The interval depends on how quickly the terrain changes and on operational requirements. For extraction sites and landfills, annual or quarterly surveys are common, on construction projects the timing follows the milestones and on line corridors the vegetation cycles. What matters for comparability is that the same capture and processing methods are kept.
Does an analysis replace an inspection on site?
The analysis replaces laborious inspections on foot in rough terrain and shows damage or conflicts with vegetation across the whole area. It focuses the inspection effort on the conspicuous places. The final structural or ecological judgement remains with the responsible engineers and experts on site.
How do LiDAR analyses differ from those based on aerial images?
Airborne LiDAR penetrates the canopy with multiple echoes and provides reliable terrain models under forest as well as fine geometry such as overhead conductors. Photogrammetric aerial images, on the other hand, offer the highest spectral resolution for visual damage mapping, orthophotos and vegetation indices. Complex analyses combine the geometric strength of laser scanning with the radiometric information of the image data.
In what form do I receive the results?
You receive structured tables and values as proof of quantities as well as plans and sections to scale. All geodata are handed over in the Swiss reference system LV95 in standardised formats such as GeoTIFF, DWG, DXF, SHP or GeoPackage. We agree interfaces and tiling schemes with you in advance, exactly matched to your specialist software.
Which data does your project need?
We advise you without obligation and show which services and which platform suit your project.